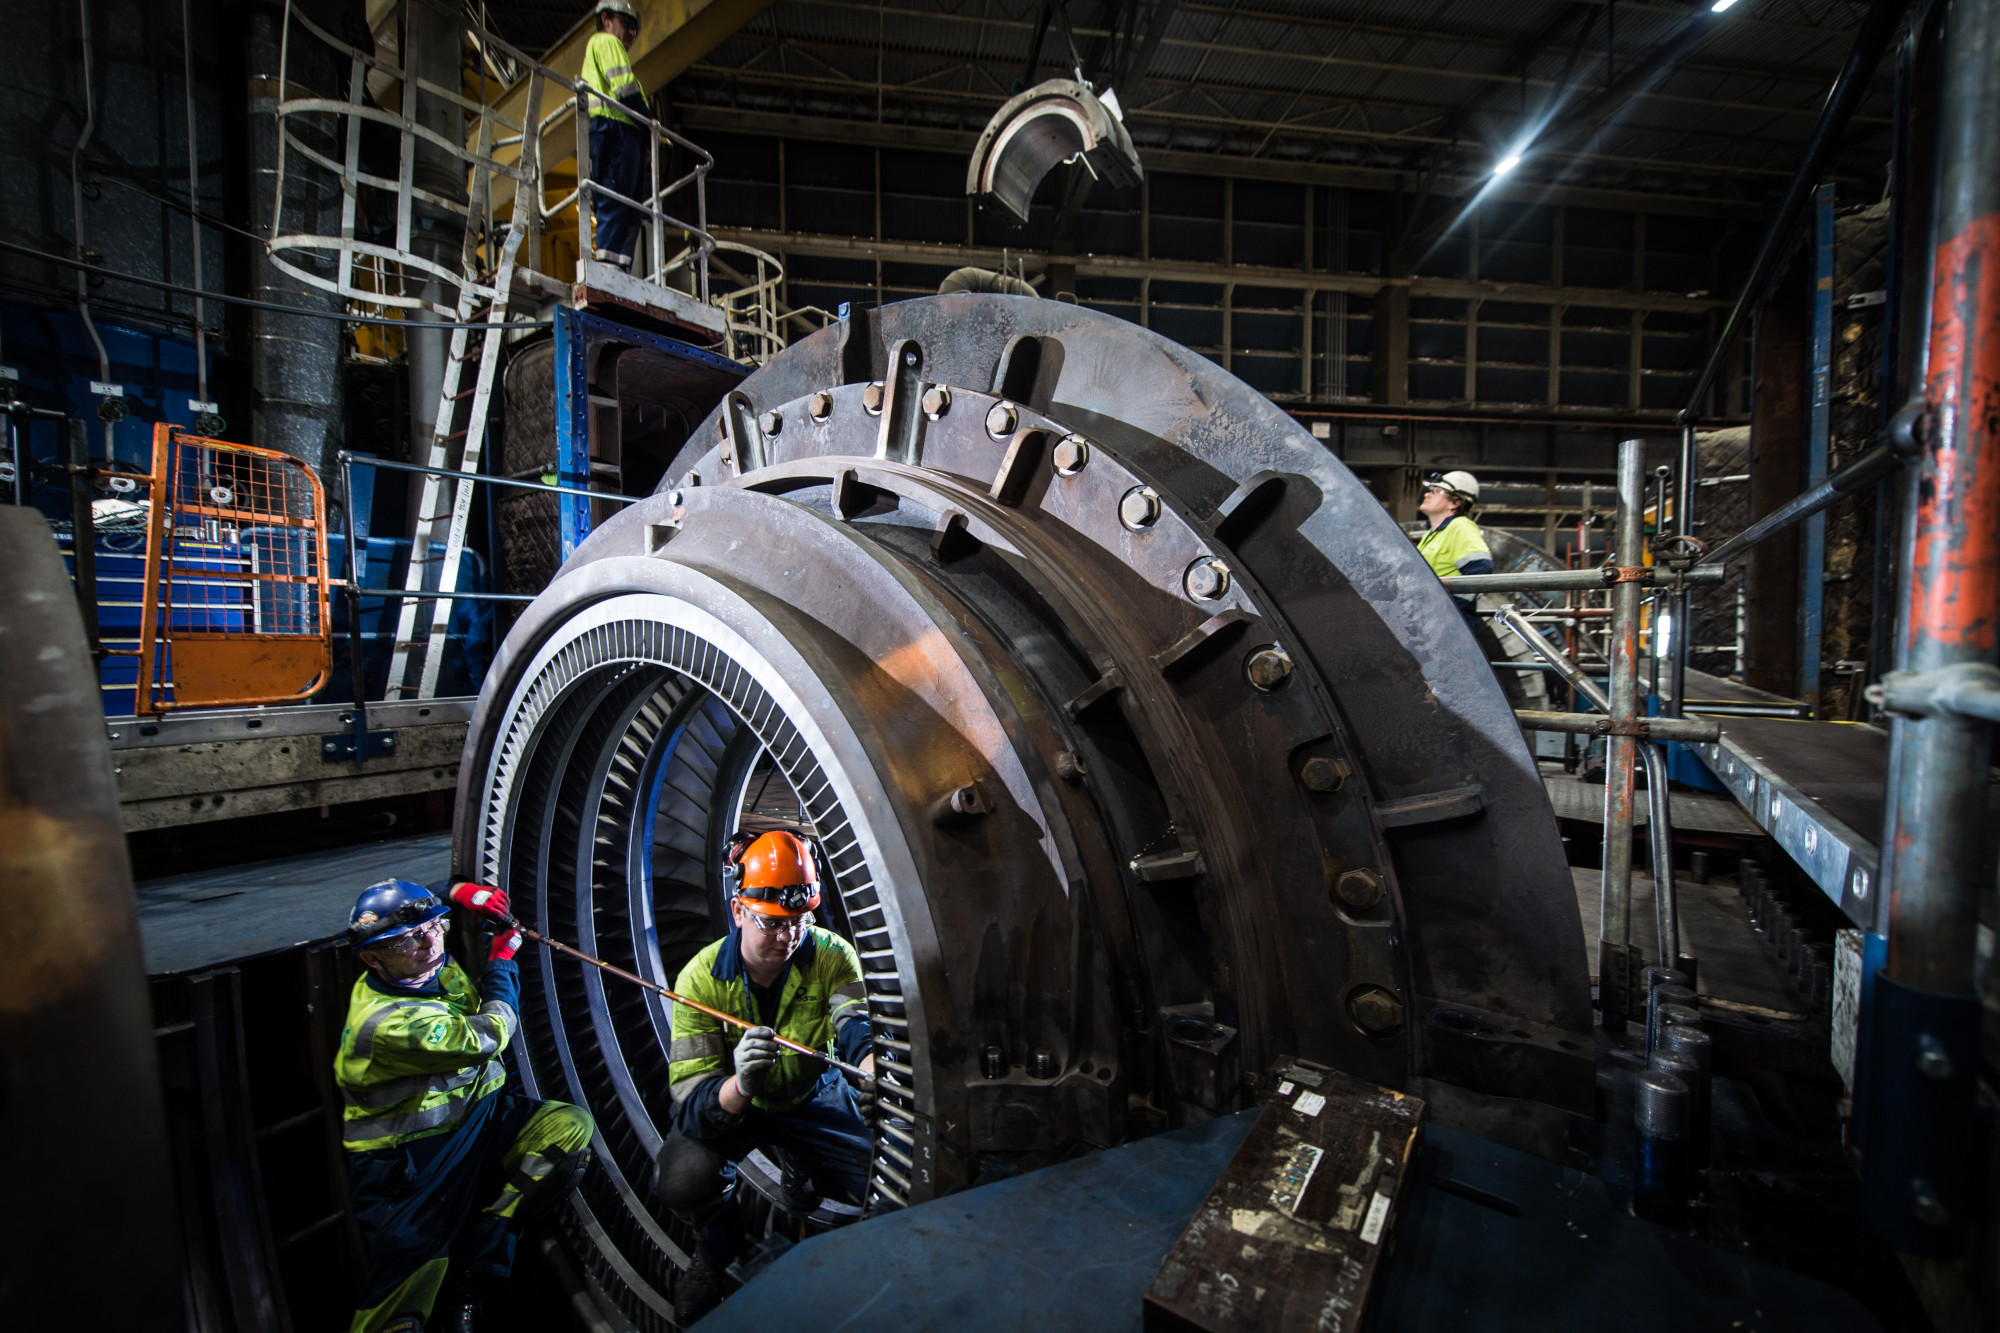
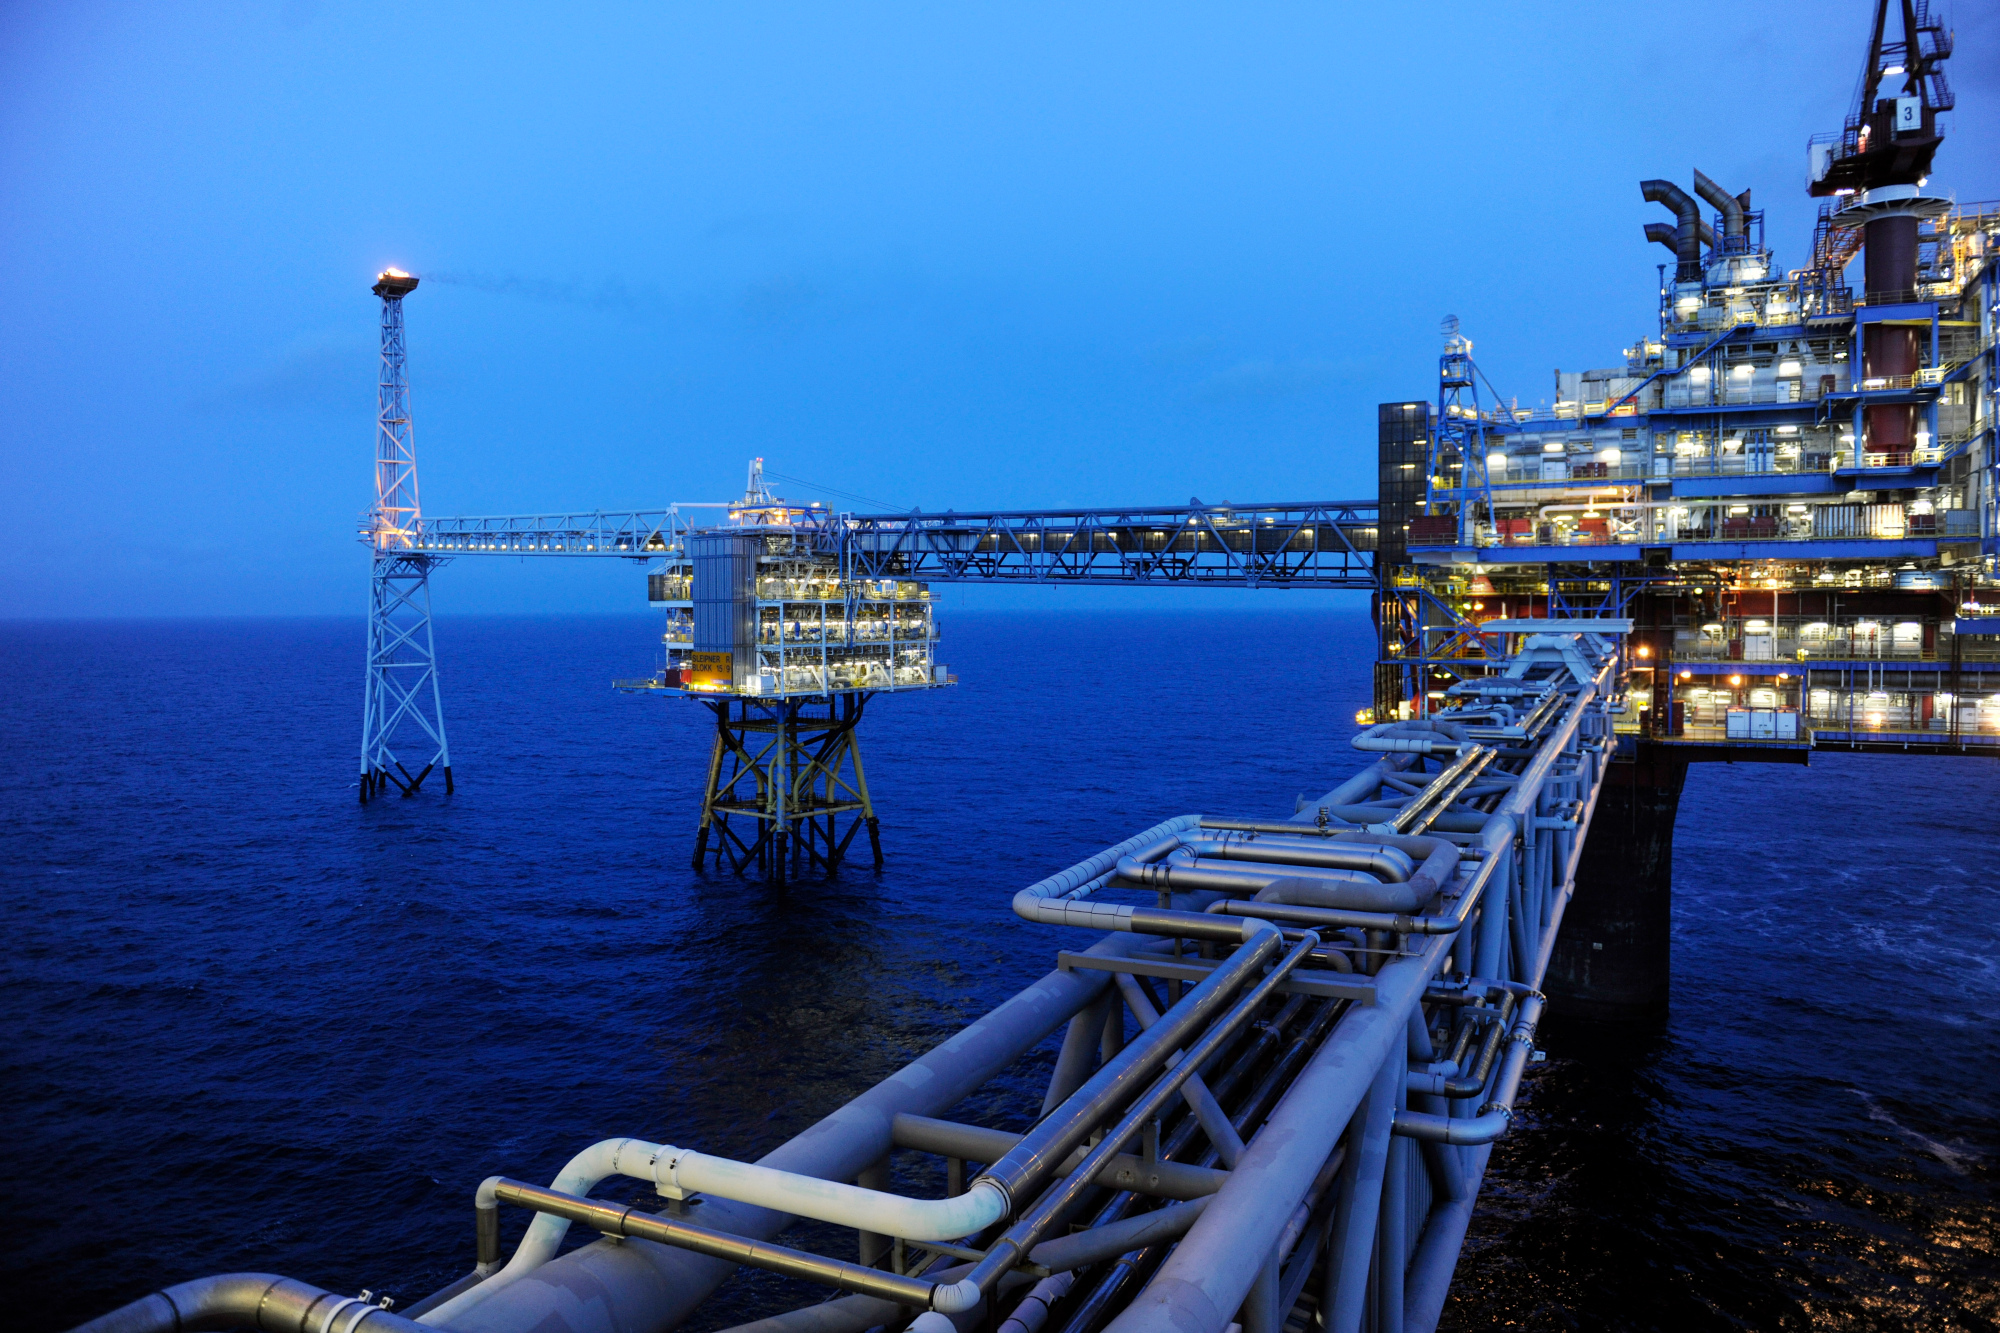
Image: The Gorgon Project gas field in Australia, home to Chevron’s flagship carbon capture facility. The CCS project has had consistent issues since 2017, and is still failing to meet its target capture rates. Copyright: Chevron
This is the third article in our series about carbon capture and storage (CCS), and looks at the practical difficulties in making a facility safe and successful.
The first article,'What is happening with Carbon Capture and Storage', explained how the tech works, and the scale of CCS today. The second, ‘Why CCS matters: overshoot, models, and money’, covered hard to abate emissions, negative emissions, and global climate models.
Read the second articleTable of Contents
In December 2010, Mississippi Governor Haley Barbour attended a ceremony marking the beginning of a ground-breaking ‘clean coal’ power plant. Resting on a podium emblazoned with the red lighting strike logo of energy giant Southern Company, with the Stars and Stripes billowing behind him, Barbour announced that this “state of the art” facility would bring the whole world closer to the goal of “cleaner, more affordable energy”.
The carbon capture and storage plant promised to bring 1,260 jobs to the area and was central to President Obama’s Climate Plan. Four years later, the Kemper Project was $3.4 billion dollars over budget, and Bloomberg reported that it was the most expensive power plant in world history[1].
By 2016, an engineer at the plant called Brett Wingo told The New York Times “I’ve reached a personal tipping point and feel a duty to act.” His whistle-blowing revealed that staff at the plant had been concealing various developmental problems for years.
By 2017, the Kemper Project was $5.7 billion over budget, and the carbon capture plans were finally ended. The “state of the art” technology was demolished with several large explosions in 2021. Ironically, the technology designed to prevent pollution ended in huge columns of smoke, without ever capturing and storing a single tonne of CO2.
This is not an isolated case. As discussed in previous articles in this series, the vast majority of carbon capture and storage (CCS) projects have been ended or suspended earlier than planned, and without capturing significant quantities of carbon dioxide.
As with other projects, engineers at Kemper stressed that the CCS technology and designs did work. Why, then, do we hear about major CCS projects that only capture 17% of emissions, or none at all? Why do so many projects end up blaming local terrains and weather patterns for their problems as they spiral into overspending?
This final article in ELCI’s CCS series aims to make sense of the bad press you may have read about different carbon capture projects, explaining how to understand ‘capture rates’ (the proportion of CO2 captured in a CCS facility), some of the reasons these plants can be so expensive to develop, and some of the logistical risks involved.
The complexity of capture rates
Despite it being theoretically possible, the vast majority of CCS projects do not aim to capture 100% of CO2 emissions. The industry standard that has “become ubiquitous in the literature” is a 90% capture rate.
A ‘capture rate’ does not relate to emissions from other parts of the process (e.g. transporting the CO2), nor does it indicate how much CO2 is stored – a 90% capture rate just means that 90% of the CO2 passing through the chemical absorbents is separated from other gases in the smokestack.
The 90% figure is the standard because capturing that last 5-10% of CO2 becomes significantly more expensive, for the same reason that direct air capture is expensive: the low concentration of CO2. The lower the concentration of CO2 in the gases, the more energy (and therefore money) is required to separate the gases.
Academics have questioned whether this 90% figure should be the standard, and even whether there needs to be a trade-off between cost and high capture rates. Authors of a 2020 study in the International Journal of Greenhouse Gas Control – the scholarly home of CCS research – could find “no case” where a capture rate as low as 90% was necessary, “with capture rates of up to 98% possible at a relatively low marginal cost.”
Increasing capture rates to 98% from 90% would be a meaningful difference, but 90% still sounds positive. Unfortunately, as with all carbon accounting, it is not this simple. Capture rates only measure the proportion of CO2 passing through the CCS facility itself that is removed – but there is more for CCS plants to offset than their flue gas. In 2019, Stanford professor Mark Jacobson studied public data from two CCS plants: one was a coal power plant, the other a direct air capture facility. Both powered the capture process using electricity from natural gas. Jacobson wanted to study the whole process, including supply chains, to determine what proportion of emissions from CCS are captured overall.
Accounting for the electricity needed to run the carbon capture equipment, and the emissions from the combustion and supply chain of that electricity production, Jacobson calculated that in both cases the equipment captured the equivalent of only 10-11 percent of the emissions they produced. That’s a long way down from 90, and shows that we need to rethink the frameworks used for capture rates. Experts and news articles discussing 90-98% capture rates is misleading.
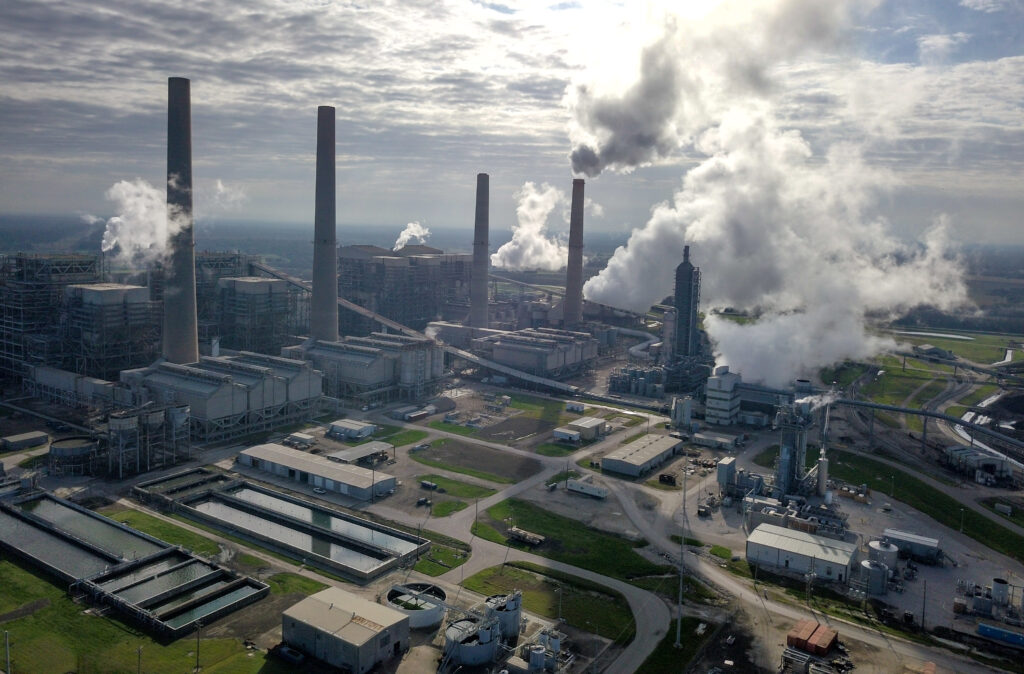
Even without worrying about supply chain emissions, reading about capture rates on existing projects can be confusing. The Texan Petra Nova project, for instance, is both referred to as an example of successful and unsuccessful capture rates by different sources. Friends of the Earth and Global Witness report that “the facility missed capture targets by around 17% since starting in 2017”, while Dr. Howard Herzog of MIT Energy Initiative said that the project met targets, and the company itself claims it exceeded its 90% target, even reaching 92.4%. These should all be credible sources: what is going on here?
A proven, definitive figure for the capture rate that Petra Nova actually achieved seems quite elusive. Following the project’s closure in 2020, a post-mortem report by the Institute for Energy Economics and Financial Analysis (IEEFA) confirmed that “Petra Nova captured 662,000 fewer metric tons of CO2 than projected during its first three years of operation” and that it had not “consistently captured 90% of the CO2”. But the report is light on detail. A short chapter titled ‘Why Hasn’t Petra Nova Captured as Much CO2 as Proponents Said It Would?’ is answered simply with “No one will say.”
“Petra Nova’s owners, the U.S. Department of Energy (which funded a substantial portion of the cost of building the facility), and the manufacturer of the carbon capture equipment all have failed to provide any information to the public to support the claims that it was operating as planned and was capturing 90% or more of the CO2 it processed.”

This problem with transparency is broader than Petra Nova. A 2021 report by the Tyndall Centre for Climate Change Research acknowledged that capture rates may be possible as high as 99%, but recommended that researchers and policymakers continue to use 90% or lower rates because “the lack of sufficient data on natural gas CCS power station capture rates, or any CCS energy application with >90% capture rate, means that it is prudent to await these results before applying high capture rates”.
The commercialised nature of most CCS operations means that there is a growing communication and transparency problem around these projects, and we do not have an accurate idea of whether CCS plants are really achieving their capture rates. Researchers and the media need clearly labelled data to understand whether carbon capture is working, and so far, this is rarely being delivered.
How is the CO2 transported from the capture facility to the storage site?
CO2 can be transported by road in tanker trucks, by train in rail cars, or even by river barge. While Korean shipbuilding company Daewoo is developing a large scale carbon dioxide carrier ship, to date vehicles can only carry relatively small amounts of CO2, and have specialised requirements due to the highly pressurised liquid ‘supercritical’ state it is normally transported in. The process of loading and unloading, often with temporary storage along the way, is also costly and time consuming. For these reasons, mass CCS deployment on the scales envisaged in models is likely to rely mostly on pipelines.
Several thousand kilometres of CO2 pipeline already exist, the large majority of which are in the USA, due to its history of using CO2 from reservoirs for enhanced oil recovery. Despite pipeline transport costing less than vehicular transport, CO2 pipelines themselves are not cheap, and need to be thicker than natural gas pipelines. Construction costs for onshore pipelines vary from over $40,000 per inch (diameter) per mile (length), to $150,000 per inch per mile, depending on terrain and other factors. A 100 mile, 12 inch wide pipeline would cost between $48 million and $180 million to build. There are then costs to transport the CO2: these can vary widely, up to around $17 per tonne per 100 miles[2]. For a large CCS project the size of ExxonMobil’s Shute Creek natural gas facility in Wyoming USA, transporting the 7MtCO2pa it aims to capture, 100 miles could cost anywhere between $1.5 million and $17 million each year.
Beyond money, one risk with CO2 transport is corrosion. Leakage is no longer a major concern with geological storage, as will be discussed below, but if water is present in the pipeline it reacts with the CO2 to create carbonic acid which can corrode the pipes. There have been cases of this happening in the past: in 2017, Chevron found leaking valves and excess water in the pipeline from its Australian CCS plant in the Gorgon gas field, to the injection wells. More recently, it has been reported that Chevron also had issues with pipeline corrosion.
While CO2 is an asphyxiant, leakage is unlikely to cause any major health problems, and many see the risk of occasional leakage as an insignificant concern, but it is something to watch if we soon start transporting vast quantities. At present, there are no reliable prediction models to anticipate CO2 pipeline corrosion.
CO2 storage capacity may be overstated, especially in Asia
Presuming we do manage to capture huge quantities of carbon dioxide, just how much can we store? How much space do we have?
According to the IEA, there is a potential storage capacity of between “8 000 Gt and 55 000 Gt” globally for carbon dioxide, far more than any major climate model proposes to use: “Even the lowest estimates far exceed the 220Gt of CO2 that is stored over the period 2020‑2070 in the IEA Sustainable Development Scenario.”
In the most recent Intergovernmental Panel on Climate Change Report, authors put the figure at 10,000Gt. To keep global heating to 1.5C, the planet has a remaining ‘carbon budget’ of 500GtCO2 or less – so 10,000Gt is far more than we will ever likely need.
Video: the EU’s Zero Emissions Platform explain how geological storage works.
This sounds great – if we have that much more storage capacity than we need, countries will, in theory, have a lot of flexibility to implement CCS in convenient locations.
Yet for well over a decade, scholars in respected journals have been warning that such estimates are misleading. In 2020, authors of a paper for Nature Climate Change wrote that “despite long-standing concerns [about] this way of thinking…the focus on volumetric capacity continues to feature in public pronouncements. Unfortunately, this volume-based perspective has contributed to a persistent narrative that storage resources will probably not constrain the overall CCS opportunity.”
The authors – three researchers from Princeton and the University of Queensland – say that this has led to normalising two incorrect conclusions. Firstly, that “geological factors are not likely to limit the contribution that CCS can make to the global decarbonization ambition”, and secondly, “that all regions will probably be able to access sufficient CO2 storage to meet their own decarbonization needs.”
More specifically, they address various issues with CCS modelling – it is worth reading the article in full – but some key takeaways are:
- Current storage capacity estimates are flawed, and likely much larger than reality.
- Assessments are not localised enough, and do not take into account the way that the liquid CO2’s movement can affect underground capacity.
- To make CCS work effectively, you have to be able to inject the same amount of carbon dioxide underground as you are separating from the smokestack or direct air capture facility. Otherwise, if you capture more than you can store, the excess CO2 just gets emitted into the atmosphere again. The main difficulty here is that eventually, as a reservoir fills up, the rate at which you can inject CO2 decreases. This is basically inevitable for geophysical reasons, but it is very hard to predict when and how the rate of injection will have to decline. This is a nightmare when planning CCS project timelines: it is likely that many CCS projects will have to lower their injection rate, and therefore possibly their capture rate, before project completion. This is especially true for large projects, and the larger the project, the sooner this decline in injection rate is likely to be needed.
- “There is no reason to think that high-quality storage resources will be adequately distributed across the world or spread evenly within countries or regions” say the paper’s authors. In particular, they express doubt about Asian storage capacities. This is worrying, because predictions that China and India will remain big emitters for some time has led to global decarbonisation scenarios relying heavily on large CCS contributions in developing Asia. Mineralisation – using a chemical process to turn CO2 into rock – may be the solution to this, but it is still in early developmental stages.
To summarise, then: estimates about global storage capacity for carbon dioxide are huge, reassuringly well above what is needed – but they are probably overblown. A sustainable injection rate will not be guaranteed for the proposed lifetime of many facilities. Detailed assessments that look into the specific geophysical risks of a local area help make predictions, but every CCS project will likely involve a lot of uncertainty.
Will CO2 leak from underground reservoirs?
Until recently, academics were concerned about leakage of CO2 stored in underground reservoirs. A leakage rate as low as 0.5% per year would mean that 63% of the CO2 is back in the atmosphere within 200 years, and as Professor Roel Sneider said in a 2016 MIT lecture, “if you have a leakage rate of 1%, you basically lose all of it”.
This is as much an issue of monitoring as technical application: in order to guarantee there is no leakage, we have to be able to measure it. In this 2016 lecture Sneider voiced doubts that we could monitor leakage as accurately as 0.1%.
Various industry experts interviewed for this article disagreed with this, stating that CCS planning now operates on a 10,000 year timescale. Norway’s Sleipner project and recent academic literature have shown that monitoring is possible as accurately as 0.01%.
Yet leakage has been an issue for several large CCS projects over the past decade. The problem for many, including Chevron’s Gorgon liquid natural gas with CCS plant, has been water, or the carbonic acid it forms with CO2. As well as corroding transport pipelines (as discussed earlier), it can damage the equipment in the injection well.
After initial leakage issues as a result of water levels in the Gorgon sandstone reservoir in Australia, Chevron had to build an additional set of wells to extract water from the formation. This still did not work, as the new wells led to sand and water rising to the surface and clogging pipes.
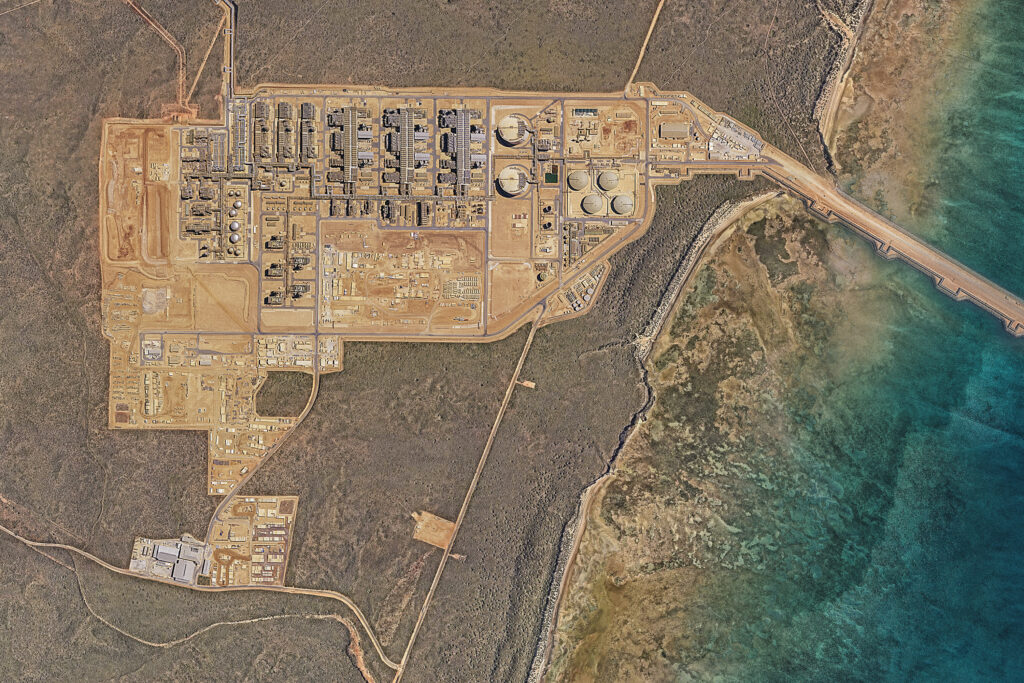
Dr. Herzog said that Gorgon’s issues were not from an “inherent problem in the CCS technology, but more some problems with the project”, and that otherwise they did operate at “design spec”. This is despite the fact that, according to Professor Jacobson, at Gorgon only “about 20% of the CO2 emitted during five years has been captured by the equipment, and not even this amount because lots more CO2 was emitted just to run the carbon capture equipment.
“The energy to run the equipment came from a fossil source with no carbon capture. So in reality, the project has emitted more CO2 than captured over five years.”
Herzog said that such issues could be expected of “pioneering” projects, and others have echoed this, such as Professor Jon Gibbins, director of the UK CCS Research Centre (UKCCSRC), describing Gorgon’s issues as “teething problems”. But Gorgon was not the first large project to run into these issues: there are remarkable parallels with BP, Equinor and Sonatrach’s In Salah CCS project in Algeria, which was suspended in 2011.
In Salah also had issues with the reservoirs, but did not try to drain it into extra wells like Chevron. In 2010, CO2 injection was suspended following a risk assessment that found concerns about “possible vertical leakage into the caprock” after “analysis of the reservoir, seismic and geomechanical data”.
According to the Global CCS Institute, 98% of global storage resources are in saline water formations.
Will CCS cause earthquakes?
Another risk with storage that is aggravated by underground water is induced seismicity: underground pressure change from injected CO2 can theoretically lead to earthquakes. This is not a new problem. According to Dr. Tom Kettlety, Oxford University’s Net Zero Research Fellow in Geological Carbon Storage, carbon storage is “not much different” in terms of risk levels to other industries that can cause induced seismicity, many of which “have been going on for at this point hundreds of years”.
Kettlety pointed to hydraulic fracking, wastewater disposal, and geothermal energy as industries that have “triggered felt events – these are events that, broadly speaking, are above magnitude two to three” on the Richter Scale. These are all industries that similarly inject or withdraw fluids from the ground. They have all been connected to the increasing frequency of earthquakes in the USA[3].
Between 1978 and 2008, there were an average of 21 earthquakes per year in the USA of magnitude three or higher; this rose to 99 per year in 2009-2013, and then to 649 in 2014.
Kettlety said that to date, “CO2 storage hasn’t actually triggered any substantial felt seismicity”, but that this is partly because successful “big, pilot projects, which have megatonnes per year scale of injection, which is what we’re aiming for,” have all been offshore – so people are less likely to feel the earthquakes.
Oil, gas, and wastewater industries have caused tens of thousands of seismic events (as, in fact, has CO2 injection). As Dr. Kettelty suggests, these are mostly very small. Not always though – there are examples from all over the world of earthquakes of magnitude six and higher, produced through industrial activity. In 1995 in Russia, for example, the magnitude 7.5 Neftegorsk earthquake killed 1,989 people. Academics later linked the earthquake to oil extraction.
Quakes from injection, rather than extraction, have never reached this scale. But fluid injection has still caused significant incidents, such as the two magnitude 6.5 earthquakes in 2000 caused by Hellisheidi geothermal field. They were the first major seismic events in the country in 88 years, but continued injection at the site caused another two magnitude 6 earthquakes in 2008. Both events caused injuries and damage to buildings[4].
Earthquakes in Northern Italy in 2012 killed at least 24 people, and left hundreds injured. Academics have since fiercely debated whether these events, known as the Emilia Sequence, were induced by wastewater injections, and/or oil and gas operations[5].
These are just three examples from The Human-Induced Earthquake Database, an academic project to compile a list of industrial projects that have caused induced seismicity. There are over 1200 entries. If we were to build the 2000 CCS facilities the IEA say we need by 2050, is this list going to get a lot longer?
Dr. Kettlety does not think so. He said that “the likelihood of big [seismic] events is very low” for CCS, and that with detailed assessment and monitoring, large quakes could be avoided.
Aside from safety, one point of concern is that if a fault (a fractured area between two blocks of rock) fails, could it become a “hydraulic conduit”, allowing CO2 to leak back up and out of the fault?
Kettelty said that the general consensus is that this is “very unlikely”, but that it is a point of some academic disagreement. “That’s still a point of research.”
In terms of human impact, Kettelty sees the risk with induced seismicity less in terms of damage or physical danger, and more in terms of “what’s called the social licence to operate.”
“If the earthquakes happen, what the hydraulic fracturing case has shown is that felt events are almost certainly going to make people in the local area feel as if the operation isn’t safe, even though it is.” To make CCS a success, it needs to operate in a way that “everyone feels comfortable with”.
At the moment, there is no international regulatory framework for induced seismicity – every country, and often even smaller authorities within those countries, determine the socially acceptable magnitudes of earthquake.
Kettlety said that seismicity is generally regulated around the world through a traffic light system, but that thresholds for each colour vary:
“You have green events, where anything below a certain threshold and size are all fine. Then you have amber where, you know, you’re slightly concerned about the size of these events, but they’re not going to stop you from injecting. But you want to investigate, you might reduce the rate that you’re injecting. And then you have red events where above that threshold, you basically stop injecting, and you then pause the operation and work out what’s going on.”
To demonstrate the disparities between how different countries use this model, Kettlety described how parts of Canada use magnitude four as their red-light threshold, whereas projects in the UK have previously used 0.5 as their red-light threshold. Earthquake magnitudes use a logarithmic scale (so a magnitude two is 10 times greater than a magnitude one), which means this threshold for stopping operations in Canada is 10,000 times bigger than the English example.
“There’s certainly a need to unify regulation – even within a given country. Right now in the UK there’s no uniform regulation for induced seismicity…the thing that we’re trying to work on is making sure the regulators in one part of the UK even talk to the other regulators.
“On an international level, that problem is even greater.”
The big picture
Last week, UK newspaper The Independent reported that the largest direct air capture facility in the world is running months behind schedule, after consistent malfunctions since its launch in September 2021.
Once again, we have been assured that the malfunctions are “not high-tech stuff”, and that the “core technology” works. Once again, failures are blamed on the local environment in which the facility was situated – this time, Climeworks say the need to “redesign parts of the technology” was due to it not being prepared for the cold temperatures of an Icelandic winter.
From Algeria to Iceland to Australia, carbon capture projects stall or fail due to an apparently naïve lack of planning specific to the local terrain and climate. Nearly 80% of large scale CCS projects to date have been ended or suspended early, and 21 out of 27 currently operational CCS facilities are used to extract more oil.
Meanwhile, the latest IPCC report described carbon capture as a “critical mitigation option” that “could allow fossil fuels to be used longer”, despite it being unlikely we will have enough water, land space or energy for the IPCC scenarios that rely heavily on Bioenergy with CCS or direct air CCS. The alternative path of degrowth – where everyone uses less energy and buys and makes less stuff – seems unlikely to become politically appealing.
This is the bind that climate mitigation is now caught within. Carbon capture may have the potential to demonstrate the historic ingenuity and technical marvel of our times – but so far, it is shining a light into the cracks within corporate planning and transparency, political process, and capitalism itself[6].
This may seem grandiose, but millions of lives are entangled in the future success or failure of CCS, unless we rethink our approach to climate modelling and planning on a global scale. Fossil fuel companies should not be funding scientific models that make us existentially dependent on new technology that they favour, and intergovernmental modelling should not prioritise gross domestic profit over biodiversity and sustainable development.
Changing the rules this late in the game is never going to be appealing – but sometimes it is the only way to win.
Endnotes
[1] From Bloomberg: “According to a Sierra Club analysis, Kemper is the most expensive power plant ever built when measured by its generating capacity. The plant will end up costing more than $6,800 per kilowatt. By comparison, a modern natural-gas plant costs about $1,000 per kilowatt, according to the U.S. Energy Information Administration. A nuclear plant costs about $5,500.”
[2] This is for a “large scale pipeline”, here meaning a throughput of at least 10MtCO2/yr.
[3] One of the main sources for this series, including for this claim about earthquakes, is Dr. Howard Herzog’s 2018 book, Carbon Capture, published by MIT Press.
[4] See Sigbjörnsson, R. South Iceland Earthquakes 2000: Damage and Strong-Motion Recordings. Earthquake Engineering Research Centre; ‘Strong earthquake rocks Iceland‘, BBC News, 29/5/2008
[5] E.g. Astiz et al. (2014), On the potential for induced seismicity at the Cavone oilfield: analysis of geological and geophysical data, and geomechanical modeling; Dahm, T.S. et al. (2015), ‘Discrimination between induced, triggered, and natural earthquakes close to hydrocarbon reservoirs: A probabilistic approach based on the modeling of depletion-induced stress changes and seismological source parameters‘, J. Geophys. Res. Solid Earth, 120; Juanes, R. et al. (2016), ‘Were the May 2012 Emilia-Romagna earthquakes induced? A coupled flow-geomechanics modeling assessment‘, Geophys. Res. Lett., 43, 6891– 6897; Cheloni, D., et al. (2017), ‘Geodetic model of the 2016 Central Italy earthquake sequence inferred from InSAR and GPS data‘, Geophys. Res. Lett., 44, 6778– 6787; Antoncecchi, I., et al. (2017). ‘Lessons learned after the 2012 Emilia earthquakes (Italy) in matter of hydrocarbon E&P and gas storage monitoring‘, 16th World Conference on Earthquakes; Styles, P., et al. (2014). Report on the Hydrocarbon Exploration and Seismicity in Emilia Region.
[6] Anticapitalist theorists are increasingly using carbon capture, and BECCS particularly, as an example of why climate mitigation cannot operate successfully through current economic systems – for example, see Vettese & Pendergrass (2022). Half-Earth Socialism. Verso. Pp.61-64
Bertie Harrison-Broninski is an Assistant Editor at The Land and Climate Review, and a researcher studying bioenergy and BECCS policy for Culmer Raphael. He is also a freelance investigative journalist, with recent work including Al Jazeera’s Degrees of Abuse series and John Sweeney’s book on Ghislaine Maxwell. Find him on twitter @bertrandhb.
